There is a gut sense—usually backed by anecdotes—that some assets are riskier than others, but it is hard for security teams to make risk-based security decisions without solid evidence.
Asset management is a critical element for managing risk, because organizations can’t protect systems they don’t know about. The fifth report in Kenna Security’s Prioritization to Prediction series analyzed data from more than 9 million active assets across nearly 450 organizations to understand the “comparative risk surface” of using Microsoft, Apple, Linux, or Unix-based systems. Security teams with a comprehensive view of all the assets are more likely to have a more complete understanding of their risk. And asset mix, or the type of platforms and technologies being used, is one of the key factors in minimizing the organization’s risk, according to the data from the In Search of Assets at Risk report.
“Determining where and how your infrastructure is vulnerable—and to what degree—can’t be a guessing game,” said Ed Bellis, CTO and co-founder of Kenna Security.
The research, conducted with Cyentia Institute, found that a platform’s level of risk depended on multiple factors, including the density of high-risk vulnerabilities and the “fix rate” (how often issues are being addressed). Some platforms are more likely to have vulnerabilities than others, and some platforms make it easier to apply updates and address security issues than others. But very rarely do platforms do both. Security leaders have to balance the factors in a way that makes sense for their organization.
The typical organization manages vulnerabilities across 800 active assets, but the range is a pretty wide one, from less than 10 to over 1 million. About 10 percent of the organizations in Kenna Security’s dataset manage more than 35,000 assets. That is a lot of assets and vulnerabilities to manage. The organizations in the report also reflected the reality of the market—more than half of the organizations in the report had Windows running on at least 85 percent of their systems.
“Companies need to align their risk tolerance, strategy, and vulnerability management capabilities around these trade-offs," said Wade Baker, partner and founder at Cyentia Institute.
The report looked at vulnerability density (the median number of vulnerabilities detected on assets), high-risk density (median number of high-risk vulnerabilities), percentage of assets at risk (having at least one open high-risk vulnerability), vulnerability half-life (days required to remediate half the vulnerabilities), high-risk coverage (percentage of all high-risk vulnerabilities remediated), fix-rate (median percentage of total vulnerabilities closed in a given month), and net capacity (percentage of assets where high-risk vulnerability closures meet or exceed new vulnerabilities).
Number of Vulnerabilities
All software has vulnerabilities. Vulnerability density, or the number of vulnerabilities that exist in an asset, gives an idea of how many issues need to be triaged to keep that asset secure. While having lower density would be considered better—fewer vulnerabilities to worry about fixing—having higher density doesn’t automatically mean poor security, the report said. An asset could be more exposed because it has more third-party applications installed, or because of the way it is configured. For example, vulnerability density in Windows is not limited to just vulnerabilities in the operating system and other Microsoft applications, but also on other software, such as Adobe Acrobat, Mozilla Firefox, and other installed tools and drivers.
Windows platforms typically have 119 vulnerabilities across its own code and third-party applications in any given month, which is four times the median number of vulnerabilities (32) in Macs. The median number of vulnerabilities in Linux is just 7. Network devices such as routers, printers, and Internet of Things appliances have an average of only 3.6 vulnerabilities per month.
A little shy of 72 percent of Windows systems had at least one high-risk vulnerability, or an open vulnerability with known exploits, while that was the case for a little over 30 percent of Macs. A little over 40 percent of Linux/Unix systems had at least one high-risk vulnerability. Network devices and appliances had was right behind the Macs, with 30 percent having at least one open vulnerability with known exploits.
It is easy to conclude that networks with Windows systems are “in dire straits with respect to risk exposure,” but that isn’t the case because the number of vulnerabilities tells only one side of the story, wrote the report’s authors.
Fixing Vulnerabilities
The other side of the story involves the vulnerability half-life, fix-rate, and high-risk coverage. Microsoft assets tend to be updated faster in the enterprise than other platforms—36 days on average, according to the report. The speed may be related to the fact that Microsoft has a regular cadence of security updates through its Patch Tuesday releases and an automated mechanism for delivering those updates. In comparison, the vulnerability half-life for network devices such as routers and printers is more than a year—369 days. And that’s even assuming people know about those updates and apply them.
Network devices may have fewer vulnerabilities overall, but each one tends to have a long shelf-life.
Not only are administrators faster at patching vulnerabilities in Microsoft products, they are much more thorough about keeping those systems updated. The report looked at remediation coverage, or how much the vulnerabilities have been addressed, and found that 83 percent of vulnerabilities in Microsoft platforms are updated. Macs have the second highest coverage, at 79 percent. Linux has only a 63 percent coverage, and network devices/updates have 64 percent coverage.
"Vendors and platform providers are very influential in determining how much of a security risk their products pose to your infrastructure," Bellis said.
In raw numbers, that translates to about 179 million vulnerabilities patched on Windows systems in organizations during the study period, and just 438,000 vulnerabilities on Macs. So yes, Microsoft platforms tend to have many more exploitable vulnerabilities than any other platform category, but administrators have the mechanisms to fix critical vulnerabilities on Microsoft assets quickly and thoroughly.
There was one interesting note about the rate of vulnerabilities getting fixed on Windows-based assets: administrators are much quicker addressing the flaws in Microsoft code than in third-party code. Enterprises patched 68 percent of vulnerabilities in Microsoft code, such as the operating system and Microsoft Office, in the first month, while only 30 percent of vulnerabilities in third-party applications on the same assets were fixed in that same timeframe.
Assets Matter
Understanding what kind of assets the organization has is an important factor in vulnerability and risk management. If the goal is to minimize opportunities for attackers to exploit systems on the network, a Windows-heavy environment will make that "more challenging from the start," but if the goal is to maximize the ability to remediate vulnerabilities quickly and comprehensively, a Windows-heavy network "gives the best chance of hitting that mark," the report's authors concluded. "What’s best for your organization comes down to aligning risk tolerance, strategy, and capabilities."
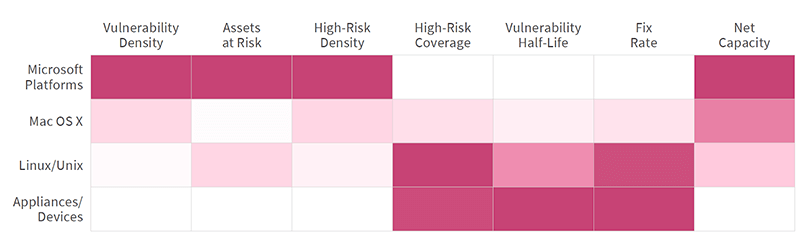
The heat map compares vulnerability and remediation metrics across major asset categories. Darker red areas show a higher value. While Microsoft assets have higher vulnerability density, network devices have higher vulnerability half-life. Which one is worse depends on the organization's risk tolerance and security strategy. The original figure in the report lists median numbers and percentages. (Source: Prioritization to Prediction, vol 5: In Search of Assets at Risk, Kenna Security)